


.jpg)
.jpg)
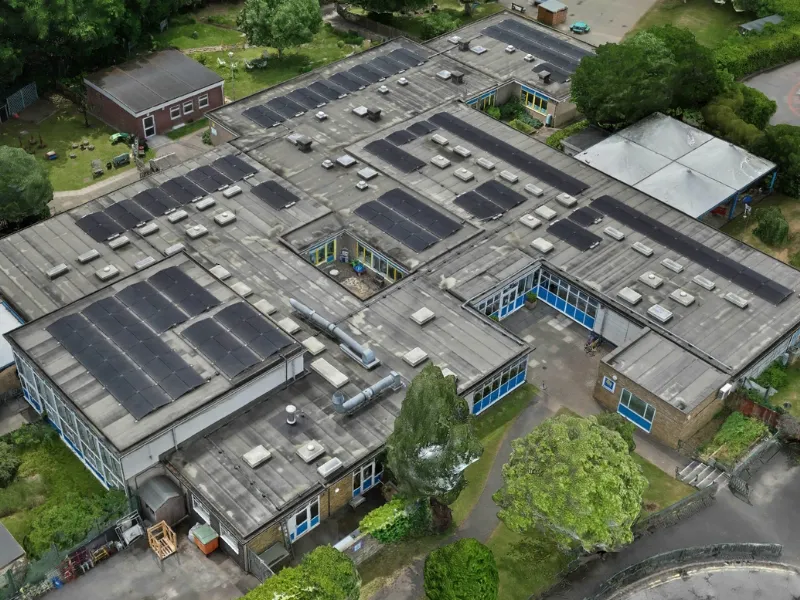
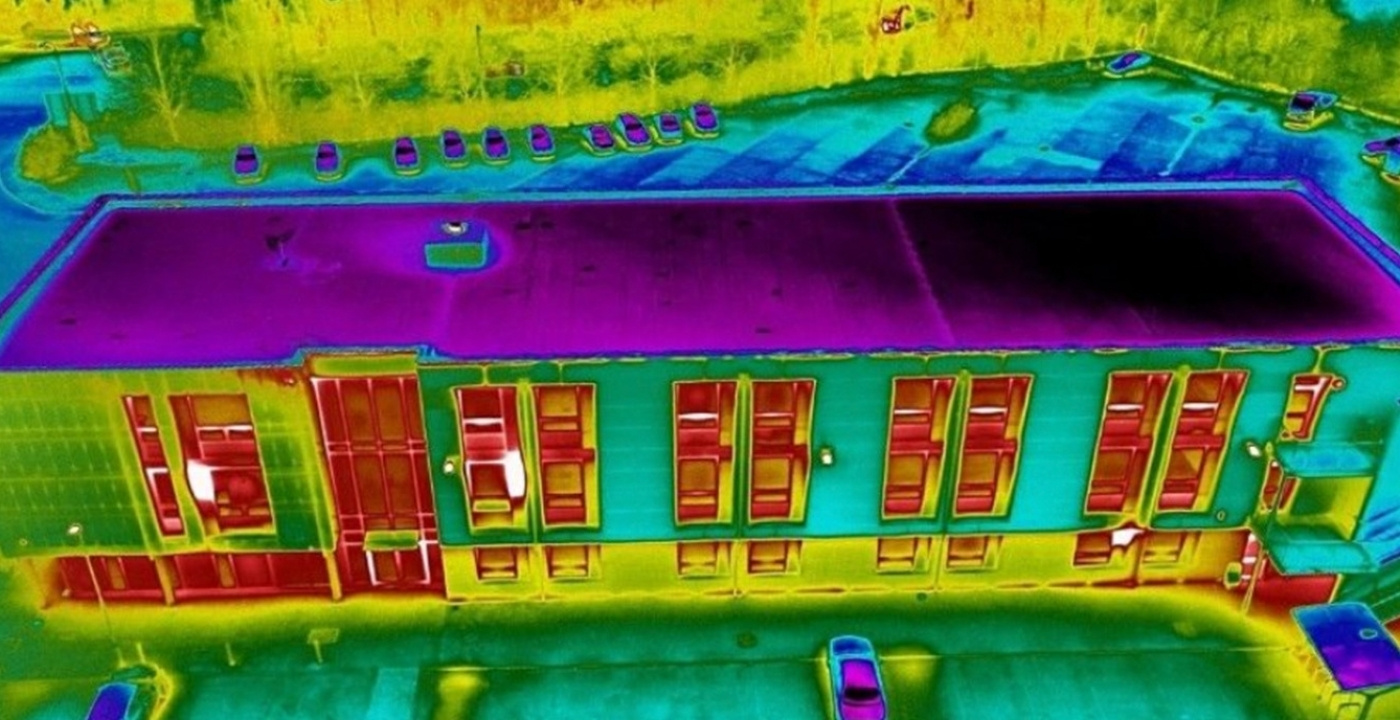
Yorkshire Housing were advised to undertake a full roof replacement costing c. £350k. Vantage UAV's drone inspection & 3D model revealed only c. £50k of work was required - an 85.7% cost saving!
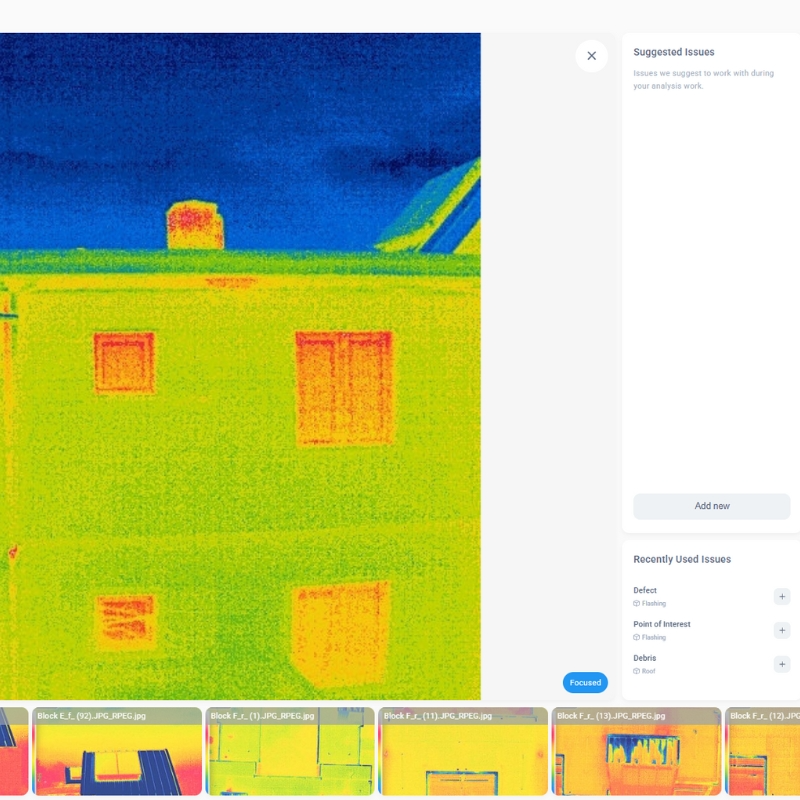
Thermal imaging technology detects temperature variations and heat signatures invisible to standard cameras. Our drones carry a variety of thermal cameras with accuracy of ±2°C or ±2% (whichever is larger) enabling sensors to capture precise temperature differences across surfaces, revealing hidden defects, insulation failures and operational inefficiencies. This non-invasive approach identifies problems before they become costly failures or safety hazards.
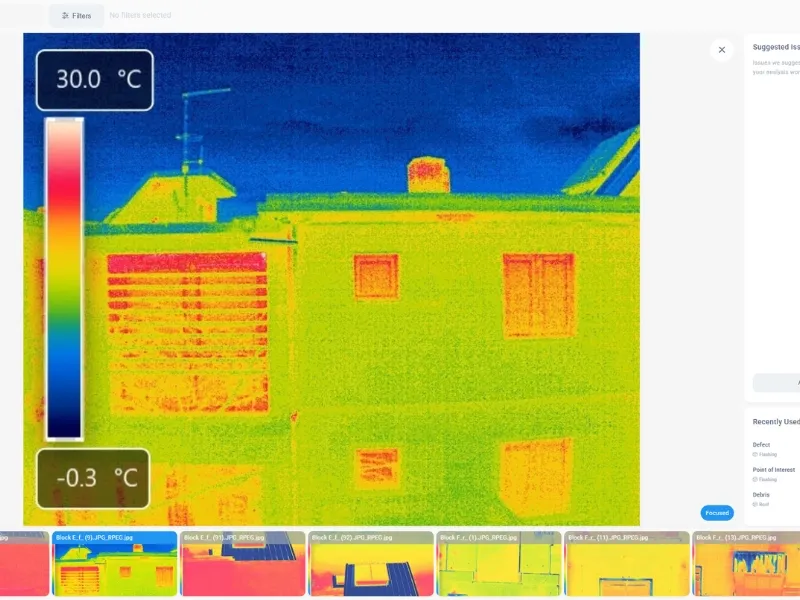
Thermal imaging works by measuring the infrared radiation emitted by an object, with the radiation amount and wavelength directly correlating to the object’s temperature. This data is then converted into a visual image where different colours represent the varying temperatures.
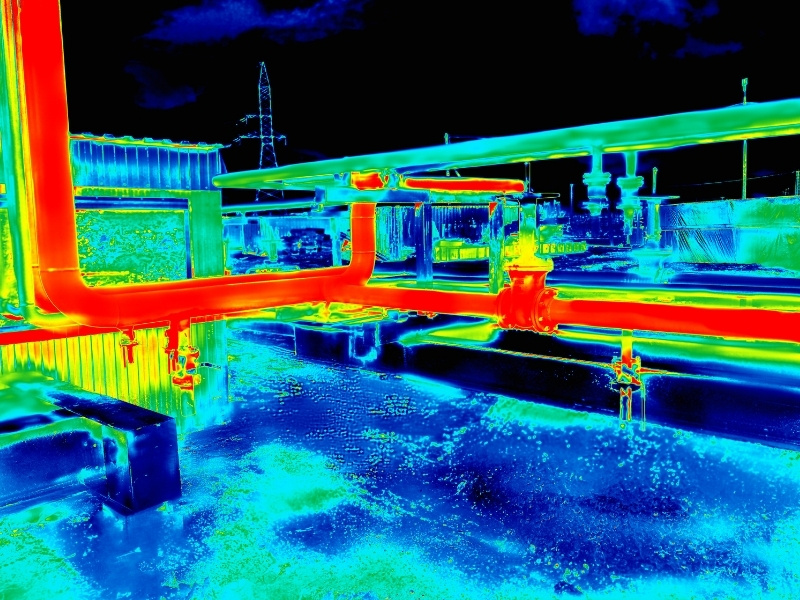
Our thermal drone capabilities identify energy inefficiencies, moisture ingress, electrical faults and structural anomalies through infrared analysis, providing critical diagnostic data for preventive maintenance and safety assessments.
Thermal imaging output is displayed visually, often through an image or video, with red/yellow colours highlighting warmer areas and blue/black colours showing cooler surfaces. Our drone thermal surveys can reveal energy loss patterns, heating system performance and insulation effectiveness across entire structures, quickly and efficiently.
These thermal profiles support energy auditing, compliance reporting and energy efficiency improvement planning, with quantifiable, GPS referenced, temperature data.

The thermal imaging data we collect is transferred to our secure data portal or exported as a file transfer, providing layered analysis capabilities within your own software or ours. Temperature readings can be annotated, compared over time and problem areas easily identified. This data can be used to inform maintenance schedules while creating a complete thermal performance digital database for asset management.

Here's some quick answers to help you understand our asset inspection capabilities better.
Our thermal sensors detect temperatures from a range between -20ºC to +500ºC with the temperature precision of ±2°C or ±2% (whichever is larger). This range covers most building and infrastructure survey-grade applications, from detecting heat loss to identifying electrical faults.
Majority of objects are inspected from a distance of 10-20metres. In some instances we can inspect from 30-40metres if we are wanting a wider overview shot of a large object/building.
Thermal imaging performs best in stable weather. Rain, fog and extreme wind can affect readings and drone flight ability. Early mornings or late evenings and nighttime flights often provide optimal thermal contrast for object/building inspections. We avoid taking thermal readings in the rain, this is because when rain settles on an object or building it can mask heat loss. It also creates reflections which are especially apparent on flat roofs - where you will only see the reflection rather than the heat signature - this is why we aim to only fly thermal missions in good, cold and calm weather.
Thermal imaging detects heat signatures invisible to standard cameras, revealing energy loss and electrical issues. Visual imagery shows surface conditions in high-resolution. Combined, they provide comprehensive diagnostic capability for asset assessment.
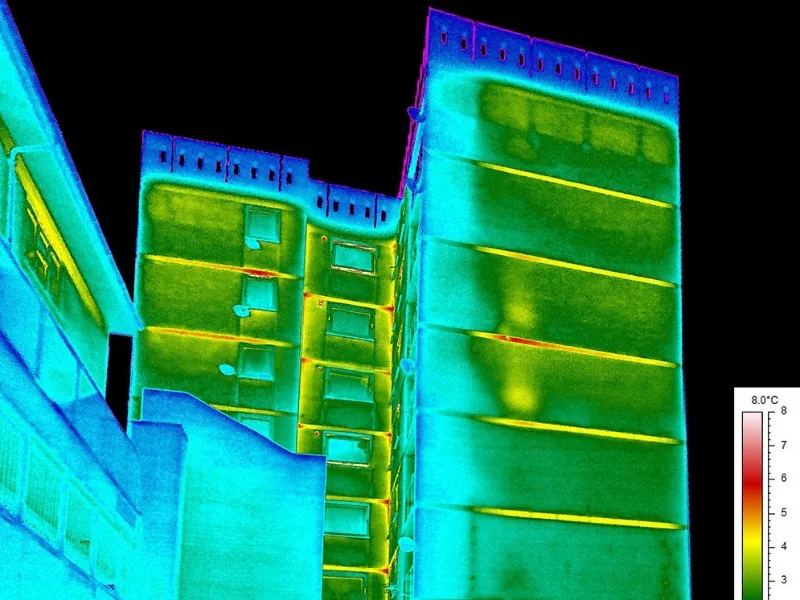
Normalisation is an important process we perform on larger thermal data sets. It helps to ensure the colour scale is consistent across the entire data set so temperatures can be compared accurately. Straight out of camera, a particular shade of yellow in image 1 may not represent the same temperature reading as that same shade of yellow in image 2. This makes it extremely difficult to compare heat loss between multiple images. Normalisation is a process that changes the temperature scales on the images so that they all conform to the same colour-temperature scale. For example, if that particular shade of yellow in image 1 is 3ºC, and it’s representing 4ºC in image 2, normalisation will adjust the scale in image 2 so the yellow shade is now representing a 3ºC temperature - effectively shifting the colour scale across the entire image. This allows for consistent data set comparison and analysis. When normalising, materials do need to be factored in (mainly for emissivity) but also the ambient conditions at time of capture, where possible we take readings for the outdoor temperature, indoor temperature, humidity, wind, etc.
We're here to answer any questions you may have.
.jpg)